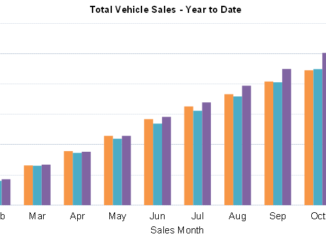
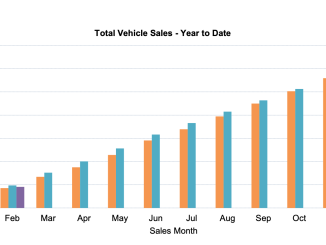
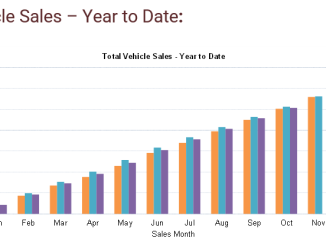
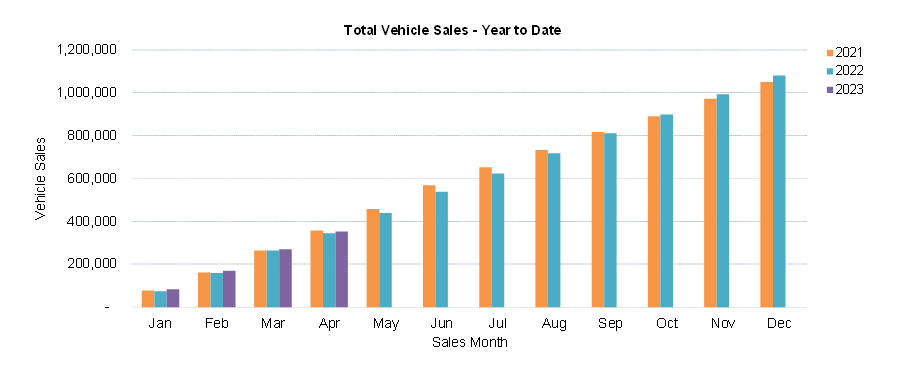
Car sales figures for April have been released and its been an interesting month. Overall sales have increased by 1.3% over April last year with some 82.137 vehicles delivered, but its traditionally a slower month due to public holidays.
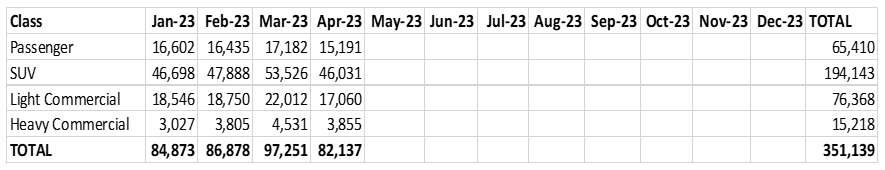
SUVs and light commercial vehicles accounted for 76.8 per cent of sales in April. Passenger vehicles accounted for 18.5 per cent, and heavy commercial 4.7 per cent.
Month to month sales often reflect when shipments arrive and along those lines Tesla has reported a good month, which has increased the overall EV sales.
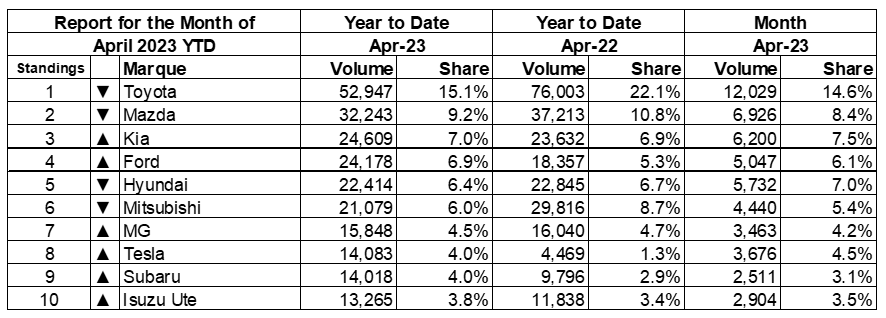
Toyota is still the dominant brand but its slipping in some key areas and the difference between them and Mazda has dropped substantially. Mazda’s market share has also dropped slightly.
Following these two are Kia, Ford and Hyundai. Next is Mitsubishi, MG, Tesla, Subaru, and Isuzu Ute.
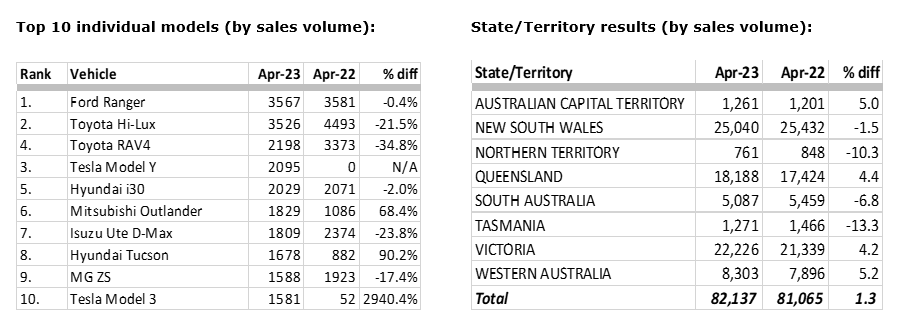
Ford Ranger was the number one model, not because they sold more than last year, but HiLux sales dropped by some 21% and RAV4 sales, the number three model has dropped by almost 35%. Is it supply constraints or is the era of Toyota Dominance in the Australian Market changing.
This is a Motoring Minute
I’m Rob Fraser
TO LISTEN TO THE CAR SALES RADIO REVIEW CLICK BELOW
More April Car Sales details
Australia’s automotive industry delivered 82,137 vehicles during April 2023, which represents a 1.3 per cent increase on the same period in 2022.
“Electric vehicles accounted for 8 per cent of sales in April. This is well up from 1.1 per cent compared with April 2022. If you take all forms of electrification, that number has increased from 9.5 per cent to 15.4 per cent, and we know that this number would have been larger had the industry not faced global supply challenges,” FCAI Chief Executive Tony Weber said.
“It is worth noting that five out of the top ten models sold in April offer some form of electrification.”
Car sales by segment
SUVs and light commercial vehicles accounted for 76.8 per cent of sales in April. Passenger vehicles accounted for 18.5 per cent, and heavy commercial 4.7 per cent.
Government and Business fleet sales increased by 8.1 per cent and 2.9 per cent respectively. Rental sales recorded a decline of 11.4 per cent.
Year to date, sales of vehicles sourced from China have increased 68.5 per cent with 13,426 vehicles sold in April. Japan remains Australia’s largest source of vehicles (22,304). Thailand is our second largest (15,886) and Korea fourth (12,952).
Sales in the ACT increased by 5 per cent compared to the same month last year, with 1,261 vehicles sold; Queensland, 4.4 per cent (18,188); Victoria, 4.2 per cent (22,226); and Western Australia, 5.2 per cent (8,303).
Sales in New South Wales decreased by 1.5 per cent (25,040); Northern Territory, 10.3 per cent (761); and Tasmania, 13.3 per cent (1,271).
Toyota led the market with 12,029 vehicles, then Mazda (6,926), Kia (6,200), Hyundai (5,732) and Ford (5,047).
The Ford Ranger was the highest selling model with 3,567 sales, followed by Toyota Hi-Lux 3,526, Toyota RAV4 (2,198), Tesla Model Y (2095) and Hyundai i30 (2,029).
Key Points:
- The April 2023 market of 82,137 new vehicle sales. Is an increase of 1,072 vehicle sales or 1.3% against April 2022 (81,065). There were 22 selling days in April 2023. Compared to 23 in April 2022 and this resulted in an increase of 208.9 vehicle sales per day.
- The Passenger Vehicle Market is down by 253 vehicle sales (-1.6%) over the same month last year.
- The Sports Utility Market is up by 3,661 vehicle sales (8.6%)
- The Light Commercial Market is down by 2,576 vehicle sales (-13.1%) and
- The Heavy Commercial Vehicle Market is up by 240 vehicle sales (6.6%) versus April 2022.
- Toyota was market leader in April, followed by Mazda and Kia. Toyota led Mazda with a margin of 5,103 vehicle sales and 6.2 market share points.